"Float"-ing the Cash Conversion Cycle
Feedback please: A proposal to adapt the CCC for the SaaS business model (and models benefitting from upfront payments)

Introduction
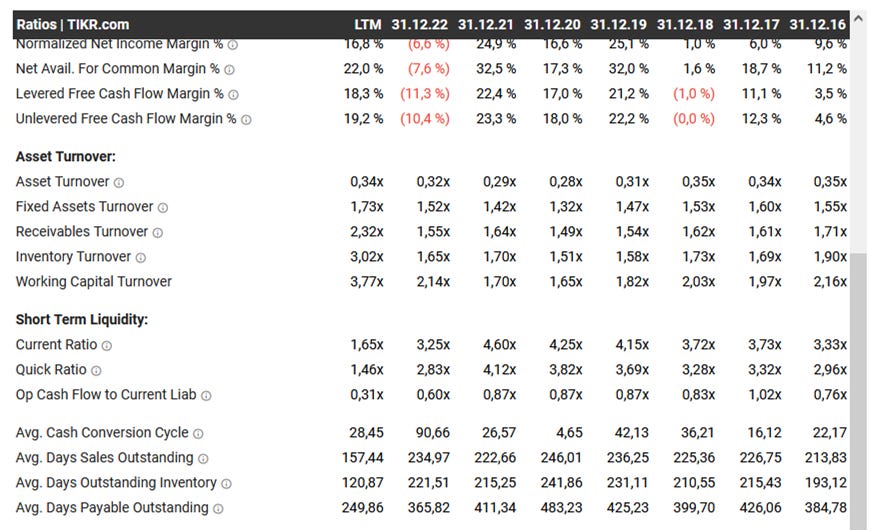
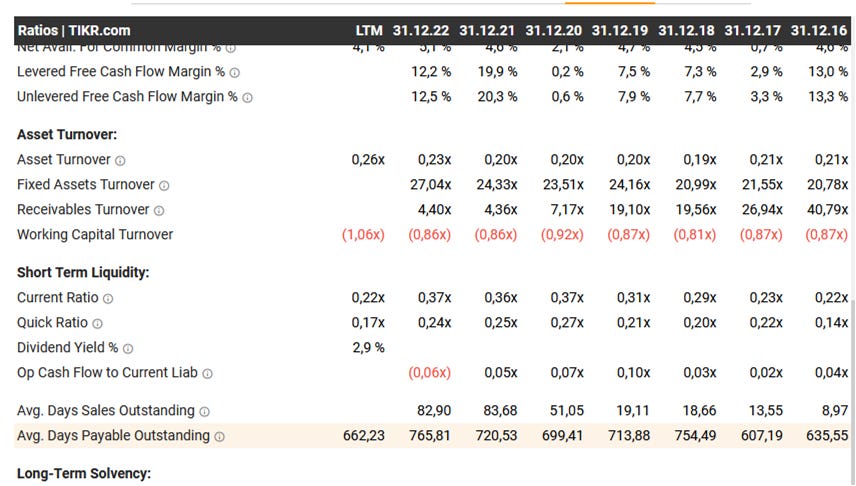
This post is inspired by the YouTube video by Thomas Chua of Steady Compounding discussing “Why a Negative Cash Conversion Cycle is Great For Business” discussing a competitive advantage of Apple. The argument immediately made sense to me. The metric is easily trackable, e.g. in Tikr Terminal, and its value and trends over time help me formulate initial views on the competitive position of a company that I analyze. While I was writing up an analysis of a SaaS company that gets upfront payments for its subscription software, I was expecting a better cash conversion cycle (CCC) number. Looking into the definition of CCC, it is clear that companies receiving float-like upfront payments (see Warren Buffet’s annual letters of Berkshire Hathaway) such as insurance businesses or many SaaS businesses are not properly reflected by the CCC. I did not find obvious fixes in the literature, although some blog entries seem to suggest quick fixes. Therefore, I thought I throw out a first proposal on how to adapt the CCC and hope to attract feedback or pointers from the internet hive mind.
After all, what can happen? In the worst case I made an obvious mistake or overlooked a standard reference. While that would be a bit embarassing (and a waste of a couple of hours of my writing time), I would learn something I hope.
The CCC; Why It Needs Improvement
There are many resources that show how to calculate it and explain its meaning, e.g. on Investopedia:
“The cash conversion cycle (CCC) is a metric that expresses the length of time (in days) that it takes for a company to convert its investments in inventory and other resources into cash flows from sales.
This metric takes into account the time needed for the company to sell its inventory, the time required for the company to collect receivables, and the time that the company is allowed to pay its bills without incurring any penalties.
CCC will differ by industry sector based on the nature of business operations.”
Basically, it is calculated (see referenced Investopedia article and Wikipedia) by analyzing the “Days of inventory outstanding” (DIO), “Days of sales outstanding” (DSO), and “Days payables outstanding”: CCC = DIO + DSO - DPO.
It is a reflection of how the company’s working capital flow is cycled in the company: the company invests money into inventory which then gets sold (for a profit, I hope). The company usually has some time to settle payment for goods, materials, and services needed to make a product which is captured in the DPO, and usually gives time to customers to pay the goods captured in the DSO. DIO measures the size of the inventory position compared to its revenue. When a company wants to grow sales it needs to invest in producing more to build up inventory, so working capital investment increases before products can be sold. For this time, the company needs some way to finance the investment either from cash flows or cash reserves or by debt financing.
Essentially, CCC represents how fast a company can convert the invested cash from start (investment) to end (returns). The lower the CCC, the better.
Source: Investopedia.
Now, the mentioned YouTube video highlights something interesting: When a company can negotiate better payment terms for itself (from customers or suppliers), the CCC is reduced. This may indicate a competitive advantage. Hence, I look for the CCC trends over time when analyzing a company. In particular, I do take note of low or even negative CCC. If CCC is negative, suppliers effectively fund the company to buy goods and services to turn into inventory, sell the goods, and collect the money (in the case of Apple in the video, long before) before they have to pay the suppliers. If long enough that company could even earn interest on the cash before settling its payables.
The negative CCC description sounds very similar to Chris Mayer’s description of Berkshire Hathaway ($BRK.A) benefitting from its insurance “float” in “100 Baggers”: collect insurance premium (effectively like a loan with no interest), invest premium to earn income, pay out any insurance claims and net the difference (if the insurance company underwrote the risks appropriately), repeat. While Berkshire now has inventory and a CCC due to that from its production business subsidiaries, pure insurance companies such as Münchner Rückversicherung ($MUV2.DE) are not provided with a CCC calculation (due to the lack of an inventory I suspect), only DSO and DPO.


For inventory-less businesses with upfront payment, i.e. subscription-based businesses, service businesses, software (in particular SaaS), or insurance, I argue that a CCC-estimate can (and should) be calculated reasonably well.
Rationale And A Proposal To Adapt the CCC
My rationale is as follows: Depending on the accounting convention, inventory sits on the balance sheet at the lower of either cost or revenue to be expected. Inventory is often decomposed into “raw goods”, “work-in-progress” (i.e. not yet finished), and finished goods (to be sold). In other words, the asset “inventory” contains the cost of materials as well as the cost to manufacture the “finished goods”. The cost to manufacture can stem from the company’s own staff working on the goods or from external services. I see little difference to the situation of providing a service or a virtual good such as software - just because it does not sit on in inventory. I believe the cost of providing a service or a virtual good to a customer can be estimated from the gross profit margin or the operating margin and the deferred revenue (DR, representing the upfront payments from customers for which service or product will have to be delivered).
The gross profit margin (GPM) of a company captures the “Costs of Goods Sold” (COGS), i.e. the cost to provide the product or service to earn revenue. Due to accounting discretion, some companies might capture e.g. software hosting costs in operating expenses instead of the COGS. Based on the definitions:
DIO = inventory / (COGS / 365)
DSO = accounts receivable / (revenue / 365)
DPO = accounts payable / (COGS / 365)
GPM = (revenue - COGS) / revenue
I propose:
expected gross profit for the deferred revenue position: GP* = DR x GPM
expected COGS for deferred revenue: COGS* = DR x (1-GPM)
there is no inventory in e.g. a SaaS business, but the software is already built. Hence, a capitalized R&D expense (and maybe a portion of capitalized SG&A) net of amortization can be taken instead of inventory.
Receiving upfront payments in the form of deferred revenue should offset waiting for payments.
An adjustment for DPO can be calculated by substituting COGS* into the DPO formula
I believe proposals 1 and 2 are straightforward and require no leaps of faith. Proposals 3 and 4 are conjectures of mine and require discussion.
If proposal 3 is acceptable (feedback is appreciated), we can use 2 and 3 to calculate an adjusted DIO* in a straightforward way:
DIO* = (net capitalized R&D + portion of net capitalized SG&A) / (COGS* / 365)
I am currently undecided if proposal 4 might be considered somewhat aggressive. If acceptable, DSO* would become :
DSO* = accounts receivable / (revenue / 365) - DR / (revenue / 365)
Proposal 5 appears straightforward:
DPO* = accounts payable / (COGS* / 365)
I assume that akin to the DIO, DSI, and DPO calculations, averaging over the period (taking the average of the period’s beginning and end positions) may be needed.
Using DIO*, DSO*, and DPO* we can calculate an estimated CCC* for a SaaS business receiving upfront payments:
CCC* = DIO* + DSO* - DPO*
Discussion
Looking at the terms in the proposed DIO*, the entire capitalized software R&D is captured. This may be a benefit, similar in nature to an inventory of goods lasting multiple years, produced in prior years.
Determining the portion of net capitalized SG&A to be applied to the DIO* requires judgment.
I suspect that in the long-term DIO* tends towards 365, as capitalization of R&D and amortization will affect COGS* as the inventory* (my proposed substitution of the inventory in proposal 3 above) equally. I believe that makes sense: the developed software is available for sale (“in inventory”) all year - the company never runs out of products to sell. As an alternative, one could argue that there is no product inventory and avoid capitalizing R&D and SG&A altogether. Even when setting DIO* to 0 due to a lack of physical inventory, it makes sense to analyze DSO* and DPO* for a SaaS business.
For a SaaS business receiving a big share of payments upfront, DSO* is likely to be a negative number. In my opinion, this captures the most positive aspect of the business model.
Conclusion
I motivated and proposed a concept to adjust the cash conversion cycle and its constituents for the SaaS business model to help me better analyze trends in the competitive positioning of these businesses. I suspect that I overlooked something. If not, I wonder why I have not yet found an extension to the standard CCC to cover the businesses I am interested in.
I would appreciate discussion, insights, and feedback on this.
Did I miss another method that I should apply instead? Are there serious flaws to the approach I proposed?

