

Margin × Turnover: A Fresh Look at ROIIC Through DuPont's Lens
Creativity and inspiration are peculiar. The best ideas often feel intuitive yet remain undiscovered. This simple application of DuPont to ROIIC opens new doors for investment analysis.

Preface: Behold, this is now my fourth adjustment to investment metrics or analytical concepts… I am of course very interested in your feedback. Caution: this has no outside validation, yet (except for Perplexity.AI).
I was just guessing at numbers and figures
Pulling the puzzles apart
Questions of science, science and progress
Do not speak as loud as my heart
Source: The Scientist, Coldplay.

TL;DR
I introduce a novelty of financial analysis of companies: a DuPont decomposition of ROIIC. It can help with the following (and is straightforward to do):
Dynamic Investment Assessment, i.e a decomposed ROIIC offers insights into the efficiency of recent investments to evaluate the success of new strategies or expansion efforts
Marginal Return Optimization, i.e. separating incremental margin performance from incremental capital efficiency, can guide companies to optimize their growth investments, e.g. by focusing on projects that maximize both components of the decomposition
Strategic Shift Detection, i.e. as ROIIC components change over time they could signal shifts in business strategy or market conditions that affect the profitability of new investments, providing early warning of potential problems.
Acquisition Analysis, i.e. (depending on what is considered for invested capital) for acquisitive companies helps to evaluate whether acquired businesses are generating appropriate returns through improved margins, increased sales efficiency, or both.
The original intent of the article was to think through ROIC and ROIIC to develop yardsticks for evaluating a company’s execution over time as preparation for another, premium article.
In summary, the article provides a novel technique and 6 insights (reproduced from below):
Novel Technique: Combining DuPont decomposition with the ROIIC framework allows for deeper investigation of a company’s value creation strategy and evolution over time.
Insight 1: If the increase (decline) in NOPAT is bigger (smaller) than the increase of (decrease of) invested capital, value grows.
Insight 2a: The incremental return on incremental capital should be larger than capital cost to last year’s capital efficiency.
Insight 2b: The incremental capital’s costs should be less than the incremental return on capital.
Insight 3: If NOPAT margin increases more than the inverse of Invested Capital Turnover, ROIC goes up and value is created.
Insight 4: The incremental capital’s costs should be smaller than the incremental return on capital.
Insight 5: ROIIC equals the change in margin multiplied with the change in capital turnover.
Introduction
The motivation for this post originates from my attempt to develop a yardstick of evaluating a company’s progress when pursuing growth by analysing the components of Return On Invested Capital (ROIC). While a company may profitably grow even with a falling ROIC (as long as it earns more than its cost of capital on any new investments) I will focus mainly on the goal of growing ROIC through investment. The underlying motivation of mine is to prepare for a post on Innovative Food Holdings ($IVFH) and what to look out for over time. Probably most of this post will be obvious, but I believe it helps me thinking through different drivers for the future - and maybe you find it useful, too. To avoid ambiguity:
Note that I will focus in this article on a multiplicative increases or decreases of metrics like NOPAT, Invested Capital, or Sales, not additive changes. In other words, I will look at e.g. the change in NOPAT as
where subscripts indicate time periods.
While thinking about changes in capital efficiency and working with the DuPont decomposition, inspiration for a novel analytic consideration struck me: applying the DuPont decomposition to the Return On Incrementally Invested Capital (ROIIC). I admit the step is small and somewhat obvious, but I could not recall seeing it somewhere else. As I am not a scholar of (micro-) economics, I might simply not be aware of that (particular, eclectic, elusive ) article developing this approach - so I asked Perplexity.AI (with Deep Research enabled) which confirmed the idea is novel and potentially useful
The application of DuPont-style decomposition to ROIIC represents a potentially valuable extension of traditional financial analysis techniques. While DuPont analysis has been widely applied to metrics like ROE and ROIC, its application to incremental capital returns offers a novel approach that could yield significant insights for both companies and investors.
Music to my ears… I am elated… let’s get started. In case you’d like to skip ahead, feel free to jump to “ROIIC With DuPont Decomposition“ directly. Alternatively, you can also rely on the pdf export above as AI does a good job of explaining the concept without me even explaining the details.
The Drivers Of Intrinsic Value
This is not an exhaustive list of what drives a company’s intrinsic value. In this article, I will focus on: ROIC and its changes, ROIIC (which focuses on those changes), and Sales growth.
ROIC
A throwback to about ~15 months ago: in my first real content rich post about identifying multi-baggers I supported Paul Andreola’s approach with Michael Mauboussin’s and Dan Callahan’s study “ROIC and the Investment Process” that showed that total shareholder return (TSR) is determined by companies’ relative ROIC performances. Companies moving among the ROIC quintiles especially see higher or lower TSRs than those that remain static (whether high or low).

ROIIC
A well known analytic approach focusing on the ROIC changes is to analyse the ROIIC:
I believe I need to point out two things (feel free to push back on them):
If you look closely at the formula, I ignore the commonly used time shift of 1 period to claculate the change in invested capital versus the change in NOPAT. I believe this shift was originally motivated by the desire to capture a time lag between when investments are made and when they are having an effect. I however ignore that because I can create all kinds of corner cases (if the period length is one year) and considerations that render the standard approach moot1. Plus, I believe changing the subscripts can be easily incorporated in the proposed approach.
As mentioned in the introduction, I focus on a multiplicative factor expressing the change of NOPAT, Invested Capital, and Sales, not a difference. This subtlety does not change the analytic insights at all.
I will denote
aas the factor changing the past period’s NOPATbas the factor changing the past period’s Salescas the factor changing the past period’s Invested Capitalthe definitions of
bandcare analoguous to the definition ofa, in the Introduction above.
I recommend you
’s articles on the topic of ROIC, ROIIC and its calculation. The articles I refer to are not on the substack, but his Blog of Saber Capital Management (specifically, the Return on Capital Series).Note that negative ROIIC values can be either good or bad. Depending on what part of the ROIIC formula is negative:
Good: higher NOPAT with lower Invested Capital.
Bad: lower NOPAT with more Invested Capital.
If ROIIC is positive it needs to exceed the company’s WACC to indicate profitable growth (i.e. value creation) for the company. I would be remiss if I did not mention the ROIC and ROIIC summaries by Perplexity.AI’s discussion linked above.
DuPont Decomposition
For this post I will use the DuPont ROIC decomposition as it allows to discern different roads to achieving ROIC:
When looked at this way, ROIC turns into a function of NOPAT margin and the turnover of Invested Capital. According to Michael Mauboussin’s paper “Return on Invested Capital”, this allows drawing valuable insights into a company’s strategy when comparing it to its peers:
A company exhibiting high margins may pursue a differentiation strategy
A company with high capital turnover may have a production or cost advantage
Rarely companies have both high NOPAT margins and high invested capital turnover ratios.
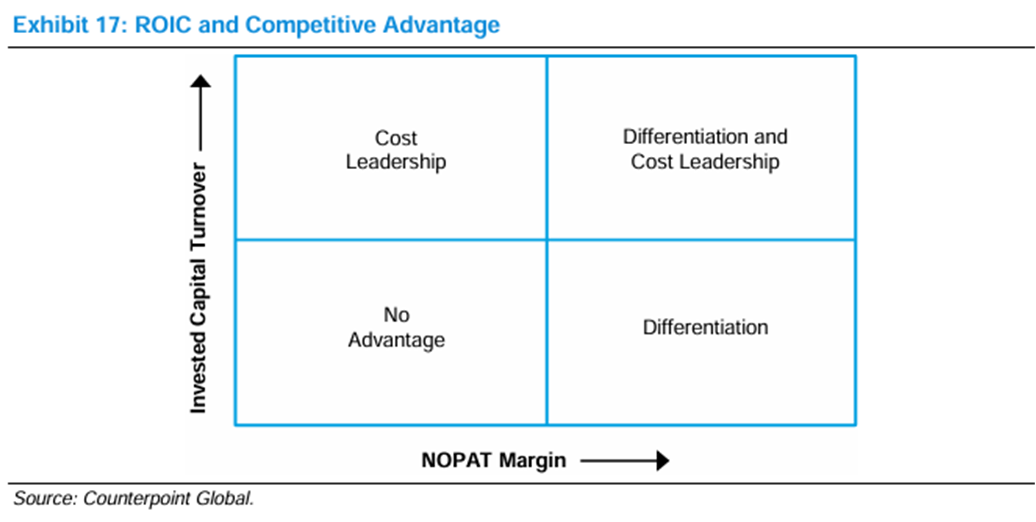
As an interesting aside: Michael Mauboussin’s and Dan Callahan’s study “ROIC and the Investment Process” indicates that “the contribution of NOPAT margin was substantially more important” among companies with higher than average ROIC.
For reference, I recently used a DuPont decomposition for comparing Garrett Motion to its peers in terms of ROIC contribution.

And of course, the Perplexity.AI article linked above also contains a good summary of the DuPont approach.
Sales Growth
We know (e.g. from Ryan Telford’s work) that Sales growth is a good contributor to multi-baggers. This is consistent with Michael Mauboussin’s Expectation Investing framework (see also Mauboussin and Callahan’s recent paper “Probabilities and Payoffs”) - the value driver Sales Growth Rate is one of three Value Drivers:

Decomposing ROIC (and ROIIC as presented in this article), allows making the contribution of sales (and sales growth in case of ROIIC) explicit in its relation to company strategy in pursuit of capital efficiency.
Deriving Yardsticks from ROIC And ROIIC
ROIC & Certain Value Creation
The original intent of this article was to prepare my Innovative Food Holdings $IVFH article. I intended to document a way to think through company decisions and announcements using the ROIC framework. In essence, I establish yardsticks to evaluate strategy and execution via insights derived from the formulas that follow.
We know from above that increasing ROIC over time should drive shareholder value. This is captured by the following relation:
From above:
Hence, the relation can be expressed as:
Therefore, if the following holds, value is definitely increasing:
Insight 1: This may be obvious, but if the increase (decline) in NOPAT is bigger (smaller) than the increase of (decrease of) invested capital, value grows.
ROIC & Profitable Growth
While less than ideal, we also know that a decreasing ROIC might still create value as long as ROIC_1 > WACC. This can be captured as
Therefore, if the following holds value is being created by growth:
Insight 2a: The incremental return on incremental capital should be larger than capital cost to last year’s capital efficiency.
Similarly, we can derive:
Insight 2b: The incremental capital’s costs should be less than the incremental return on capital.
Using ROIIC For Confirmation
As I worked with changes to the ROIC from one period to the prior period in the preceding subsection, I should derive the same insights from ROIIC considerations.
As I It seems intuitively that if ROIIC is larger than ROIC, the aggregate ROIC should increase. Therefore, value is definitely created, if:
Thus, value is surely created if
This confirms insight 1.
Similarly, we can confirm insights 2a and 2b:
and
ROIC DuPont Decomposition
Applying the DuPont decomposition approach to the initial inequality, we get:
Thus, if the following holds, value is definitely increasing:
Insight 3: While this is the same as insight 1 because variable b cancels out (the very nature of the DuPont decomposition) it provides the following: if NOPAT margin increases more than the inverse of Invested Capital Turnover, ROIC goes up and value is created. This result is inutitive from the decomposed ROIC formula: depending on the relative contribution of the two factors margin and turnover the result increases or decreases.
Similar to the prior section, we can put the decomposed ROIC also in relation to WACC. Value is created (even if ROIC declines), if:
Therefore, growth creates value if:
Insight 4: I am not sure if this is intuitive at all - the inverse of capital turns combined with the cost of capital must be smaller than the change in margin impacting the company’s ROIC to create value from growth. However, it resembles the formula to insight 2b: The incremental capital’s costs should be smaller than the incremental return on capital.
ROIIC With DuPont Decomposition
While playing with the formulas above and thinking through the relation of relative changes, I also looked at the ROIIC formula. To my surprise, the seemingly straightforward application of the DuPont decomposition to the concept of incremental returns on incrementally invested capital did not exist. Repeating the above ROIIC definition based on my notation:
It seems obvious and straightforward to apply the DuPont analysis to this notation (and it is surpising that it seems not to have been done before):
By adding a term capturing incremental sales that cancels out, we can get to insights about incremental margins and incremental capital turnover.
Insight 5: After the prior section’s insights it is not surprising that this formula shows that ROIIC equals the change in margin multiplied with the change in capital turnover.
As described by Perplexity above (and summarised in the TL;DR), this allows for evaluating investments and strategic decisions regarding incremental sales, incremental margins, and incremental capital turnover. Ideally, this should be tracked over time.
In context of my original intent and the purpose of the upcoming article, we can also use the ROIIC as a yardstick. For example, if we know investments (or acquisitions) as we do in case of $IVFH, I believe we can reasonably estimate what needs to be met in terms of margin growth and sales growth and reason whether that is achievable. Stay tuned, that will be coming in a future (premium) article.
Recall that following a ROIC decomposition we can observe strategic differences of companies with similar (or differing) ROICs. I argue that we can also use the ROIIC to perform additional reasoning and analysis.

Looking at the decomposition we four possible combinations of the two factors that correpond to the quadrants in the figure.
1) Margin term > 0, if:
lower NOPAT and lower Sales, i.e. a < 1 and b < 1; or
higher NOPAT and higher Sales, i.e. a > 1 and b>1.
2) Margin term < 0, if:
ligher NOPAT and lower Sales, i.e. a > 1 and b < 1; or
lower NOPAT and higher Sales, i.e. a < 1 and b > 1.
3) Capital Turnover term >0, if:
lower Sales and less Invested Capital, i.e. b < 1 and c < 1; or
higher Sales and more Invested Capital, i.e. b > 1 and c > 1.
4) Capital Turnover term < 0, if:
higher Sales and less Invested Capital, i.e. b > 1 and c < 1; or
lower Sales and more Invested Capital, i.e. b < 1 and c > 1.
The population of the different Quadrants is characterized as follows:
Quadrant I: 2 and 3.
Quadrant II: 1 and 3.
Quadrant III: 2 and 4.
Quadrant IV: 1 and 4.
Looking deeper into the ROIIC decomposition we see that factor b capturing the change in sales may be responsible for turning both factors margin and capital turns negative or positive when NOPAT and invested capital are held equal. In combination with movements in NOPAT and Invested Capital, that enables investors (and the company) to evaluate the strategy and potentially also the impact of competition.
Even without the ROICC decomposition, we know that a positive ROIIC, ideally larger than the costs of capital, can be achieved in two ways: both factors NOPAT and Incrementally Invested Capital are positive, or both are negative. In other words, a company can have positive ROIIC by increasing NOPAT while increasing invested capital, or it can decrease NOPAT while reducing the capital required to earn NOPAT. With the ROIIC decomposition figure 1 we see that e.g. a ROIIC of 10% is achievable via a wide range of different combinations.
On the other hand, a negative ROIIC captured in Quadrants I and IV requires closer examination as one case may be very positive (this substack comment by
mentions as much), the other is a warning sign.Positive: increasing (or stable) NOPAT combined with decreasing capital. This will result in an increasing ROIC because NOPAT increases (is stable) and capital intensity, the denominator, decreases. As ROIC increases, see above and my article on IDT, shareholder value (and TSR, see “ROIC and the investment process” above) should increase.
Negative: decreasing NOPAT while increasing (or stable) invested capital. This is a bad sign as ROIC should deteriorate.
With ROIIC decomposition we can now reason more deeply about the Positive and Negative:
Margin term > 0 & Capital Turnover <0, if:
Positive: higher NOPAT and higher Sales combined with lower Invested Capital, i.e. a > 1, b > 1, and c < 1.
Negative: lower NOPAT and lower Sales combined higher Invested Capital, i.e. a < 1, b < 1, and c > 1; or
Margin term < 0 & Capital Turnover >0, if:
Positive: higher NOPAT and lower Sales combined higher Invested Capital, i.e. a > 1, b < 1, and c > 1; or
Negative: lower NOPAT and higher Sales combined with higher Invested Capital, i.e. a < 1, b > 1, and c > 1.
Conclusion
During the process of thinking through the aspects of ROIC and its ROIIC I came across five insights and a novel analytical technique. The technique is an intuitive (and admittedly small) extension of the ROIIC framework, yet apparently there was no documentation of it in literature. I believe this is actually helpful for investors and companies - and it is quite easy to do. Therefore I put it out there and look forward to your feedback.
Novel Technique: Combining DuPont decomposition with the ROIIC framework allows for deeper investigation of a company’s value creation strategy and evolution over time.
Insight 1: If the increase (decline) in NOPAT is bigger (smaller) than the increase of (decrease of) invested capital, value grows.
Insight 2a: The incremental return on incremental capital should be larger than capital cost to last year’s capital efficiency.
Insight 2b: The incremental capital’s costs should be less than the incremental return on capital.
Insight 3: If NOPAT margin increases more than the inverse of Invested Capital Turnover, ROIC goes up and value is created.
Insight 4: The incremental capital’s costs should be smaller than the incremental return on capital.
Insight 5: ROIIC equals the change in margin multiplied with the change in capital turnover.
For example: if you thinkg about two identical companies (or alternative time lines or universes if you like science fiction) planning an identical investment with identical impact of NOPAT, but one happens to be lucky and get the investment a month earlier than the other causing the investment to be shifted to period -1 instead of period 0, the invested capital change is 0. Similarly, you can make the constructed argument that a period 0 December investment gets delayed to start-up January of period 1.
Another issue is that a January investment in period 0 has 24 months to take effect on the change in NOPAT at the end of period 1 whereas the . And changes in NOPAT (i.e. ramp up times) probably differ for different types investments - some may take 3 months, some 6, some more than a year to make a lasting NOPAT effect ofr period 1… I believe there can be all kinds of issues with the approximation.